As far as I am aware, there are three options here:
Option 1: Skip the question and score no marks.
Option 2: Learn how to get the calculator to give you the equation.
Option 3: Learn how to do the problem manually.
Here is option 3:

The slope of the required line is
^2} \\ &= \cfrac{8 \times 304 - 38 \times 96}{8 \times 252 - 38^2} \\ &= \cfrac{-1216}{572} \\ &= -\cfrac{304}{143} \\ &= -2\cfrac{18}{143} \end{align*})
and the

-intercept is
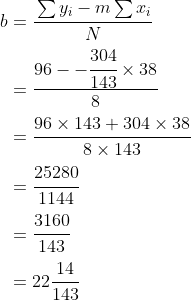
and thus, the least-squares regression line of best fit is
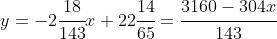
and you can see that this matches the data. It has a negative slope. No exercise (

) corresponds to our
-intercept at about 22.2 hours of TV, and no TV (

) goes with our

-intercept at about 10.4 hours of exercise. By eye, this matches our plot.
Now, we can also be asked to find the correlation coefficient,

, which is a measure of how well the line fits the data. It must satisfy

A good fit should have an
near 1 for a positive correlation and near -1 for a negative correlation. A poor fit will have an
near 0. It is usually reported as

. In this case, we have a strong negative correlation as

and

The formula is
^2}\sqrt{n\sum {y_i}^2 - \left(\sum y_i\right)^2}})
If you add a

column to the table, you should find that
, and hence can calculate that:
^2}\sqrt{n\sum {y_i}^2 - \left(\sum y_i\right)^2}} \\ &= \cfrac{8 \times 304 - 38 \times 96}{\sqrt{8 \times 252 - 38^2}\sqrt{8 \times 1528 - 96^2}} \\ &= \cfrac{-1216}{\sqrt{572}\sqrt{3008}} \\ &= \cfrac{-76}{\sqrt{11 \times 13 \times 47}} \\ &= \cfrac{-76\sqrt{6721}}{6721} \\ &\approx -0.927036... \end{align*})
Of course, the calculator could have spat out this result too, by the option 2 method.
Before anyone comments, it is true that there are different calculating formulae for

,

, and
. They are all equivalent and will give identical results to mine above, assuming that I have made no mistakes. (ADDED BY EDIT: And
@jimmysmith560 has posted one of them while I was typing all this up!
")
... Question to self... why did I type this up? lol END OF EDIT)
TAKE HOME MESSGAE: (And I am paraphrasing from the Marker's notes on quite a few 2020 trials)... It is important that ALL STUDENTS learn to use the Stats mode on their calculators for regression and correlation questions.
MY ADDENDUM: unless you'd rather learn the method to solve the problem manually.


