Help (1 Viewer)

B1andB2

oui oui baguette
Joined
Nov 6, 2019
Messages
576
Location
cuddles lane
Gender
Undisclosed
HSC
N/A
Original Poster said:
If i recall correctly all you have to do is use your calculator
change it to stat mode with frequency on then press the A+Bx function. You should see a table now
sub in the values of the table in the question into your calculator
press AC not on
then go like shift 1 "Reg" and press A and B to get those values
line has eqn y=Bx+ A i think, so just substitute and it should give you the answer i hope
 

B1andB2

oui oui baguette
Joined
Nov 6, 2019
Messages
576
Location
cuddles lane
Gender
Undisclosed
HSC
N/A
Aw shoot, my calculator can do this? Gosh daym.
Any way to do it with maths though?
yeah it can, wouldn't your teacher have shown it to you at school?

pre sure the other way is a very long, tedious and unnecessarily complicated process. It's probably shown in cambridge as a 'manual method' idk
 
Last edited:

jimmysmith560

Le Phénix Trilingue
Moderator
Joined
Aug 22, 2019
Messages
4,148
Location
Krak des Chevaliers
Gender
Male
HSC
2019
Uni Grad
2022
Back when I did statistics during my first year at uni, we were taught these:

1627445548572.png

In order to do this mathematically, I believe you have to go through these formulas (or if they're written differently in HSC textbooks). The values you need are as follows:


What you need to do from there is plug the values into the formulas, giving you Bx (B1 hat) and A (B0 hat).

As B1andB2 mentioned, it's definitely a much longer process and very inefficient for a 1 mark question.
 

CM_Tutor

Moderator
Moderator
Joined
Mar 11, 2004
Messages
2,644
Gender
Male
HSC
N/A
As far as I am aware, there are three options here:

Option 1: Skip the question and score no marks.

Option 2: Learn how to get the calculator to give you the equation.

Option 3: Learn how to do the problem manually.

Here is option 3:


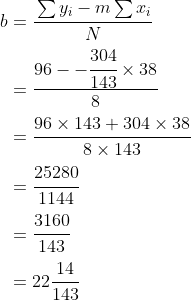
The slope of the required line is


and the -intercept is


and thus, the least-squares regression line of best fit is


and you can see that this matches the data. It has a negative slope. No exercise () corresponds to our -intercept at about 22.2 hours of TV, and no TV () goes with our -intercept at about 10.4 hours of exercise. By eye, this matches our plot.

Now, we can also be asked to find the correlation coefficient, , which is a measure of how well the line fits the data. It must satisfy A good fit should have an near 1 for a positive correlation and near -1 for a negative correlation. A poor fit will have an near 0. It is usually reported as . In this case, we have a strong negative correlation as and The formula is


If you add a column to the table, you should find that , and hence can calculate that:


Of course, the calculator could have spat out this result too, by the option 2 method.

Before anyone comments, it is true that there are different calculating formulae for , , and . They are all equivalent and will give identical results to mine above, assuming that I have made no mistakes. (ADDED BY EDIT: And @jimmysmith560 has posted one of them while I was typing all this up! :)... Question to self... why did I type this up? lol END OF EDIT)

TAKE HOME MESSGAE: (And I am paraphrasing from the Marker's notes on quite a few 2020 trials)... It is important that ALL STUDENTS learn to use the Stats mode on their calculators for regression and correlation questions.

MY ADDENDUM: unless you'd rather learn the method to solve the problem manually. :)
 

CM_Tutor

Moderator
Moderator
Joined
Mar 11, 2004
Messages
2,644
Gender
Male
HSC
N/A
Back when I did statistics during my first year at uni, we were taught these:

View attachment 31283

In order to do this mathematically, I believe you have to go through these formulas (or if they're written differently in HSC textbooks). The values you need are as follows:


What you need to do from there is plug the values into the formulas, giving you Bx (B1 hat) and A (B0 hat).

As B1andB2 mentioned, it's definitely a much longer process and very inefficient for a 1 mark question.
@Hivaclibtibcharkwa, note that @jimmysmith560 formulae and mine are equivalent. The values that he has given for


match mine exactly, and the other two are equivalent as


and similarly for and the different forms of the equation call for means (in jimmy's formulae) and sums (in mine).
 

jimmysmith560

Le Phénix Trilingue
Moderator
Joined
Aug 22, 2019
Messages
4,148
Location
Krak des Chevaliers
Gender
Male
HSC
2019
Uni Grad
2022
What are you studying in uni?
The degree I'm studying is called Bachelor of Business (Advanced Business Leadership) and my major is Human Resource Management. :)

I had to do a statistics unit relevant to business in my first year. This was one of the concepts we covered (when I did Mathematics in year 12 statistics were not in the syllabus).
 

CM_Tutor

Moderator
Moderator
Joined
Mar 11, 2004
Messages
2,644
Gender
Male
HSC
N/A
Well according to my teacher I have. But this is the first time I’m using my calculator to get an equation using a table
Well, this type of question appeared on the NESA Sample Paper (Q 37) plus several trial papers, including Blacktown Boys HS, Caringbah High, CSSA, Gosford High. Hurlstone Ag HS, North Sydney Girls High, Sydney Girls High, the Independent Schools paper, and the papers from companies that sell trials to multiple schools.

So, there are plenty of places you can look for practice... and this was a popular question last year on new content, and I would expect it on most trials and likely the HSC this year.
 

Users Who Are Viewing This Thread (Users: 0, Guests: 1)

Top